
Results at a glance
Highlighting the impacts pay-to-play fees have for public school students
99%
the percentage of parents encouraging their child to play sports if participation is free
63% of families making above 150,000 would encourage participation
yet only 34% of families making 50,000 to 74,999 would encourage participation
High fees will contribute to educational inequalities
87%
the percentage of parents who believe schools should support the cost of athletics
85.5%
the percentage of parents who expressed less enthusiasm for their child playing sports because of fees
When fees reach $500

Opinions on participation fees
As potential pay-to-play fees rise, the rate of encouragement from responding parents decreased. This is true across all income levels.
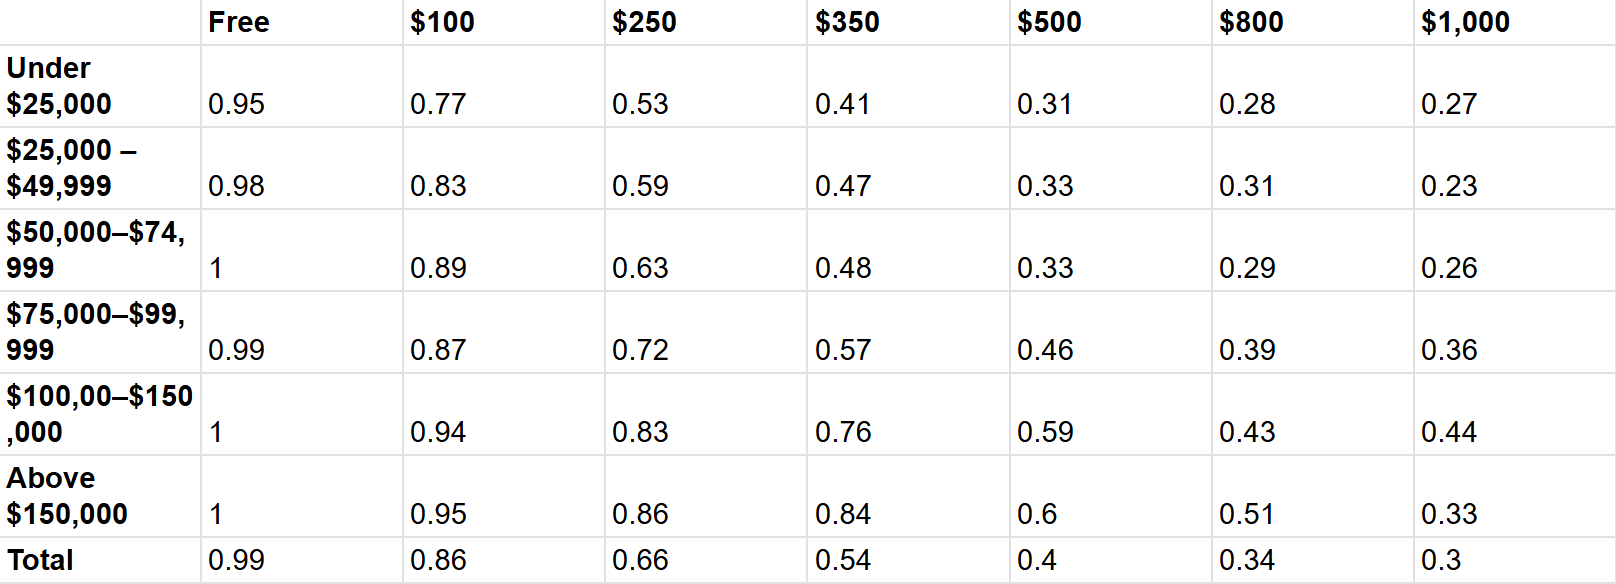
This chart demonstrates that income level matters in wether or not a student will be encouraged to participate in sports.
Regardless of income level, overall encouragement rates dropped as potential pay-to-play fees increased.
High fees will keep students off of the field.
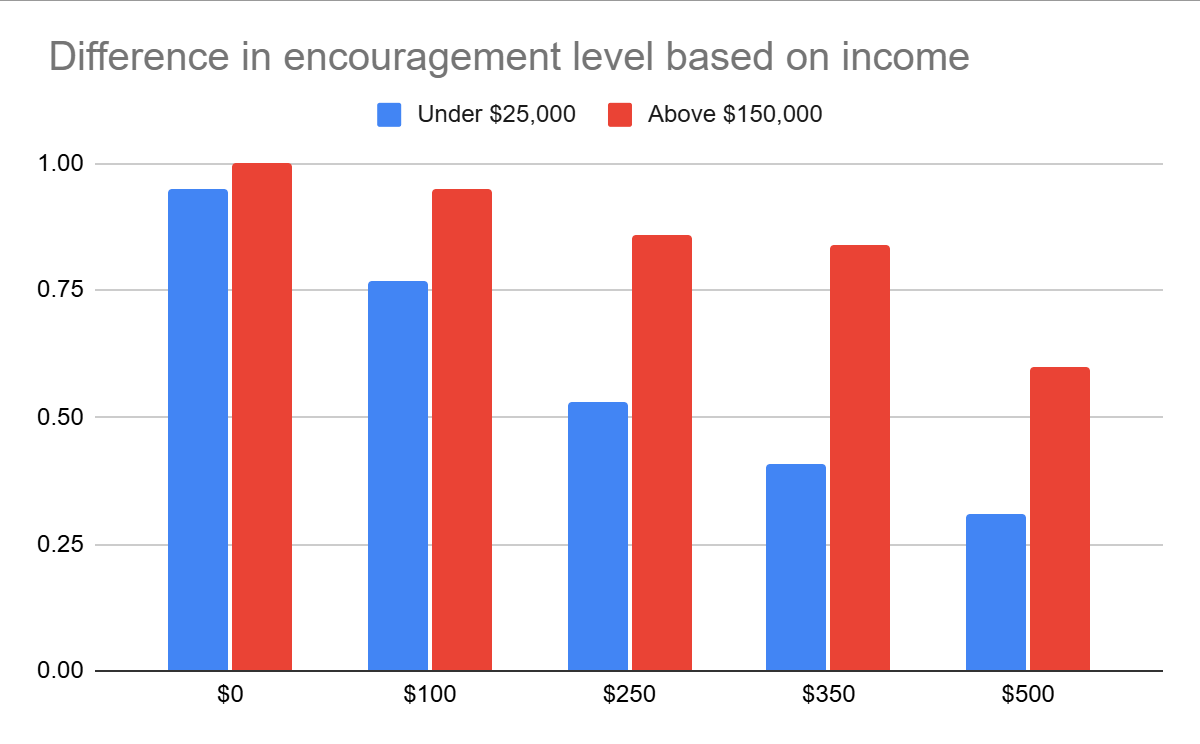
Encourament levels are lower at every cost point for families making under $25,000 compared to families making above $150,000 annually.
This chart directly shows the decrease in parental encouragment as fees rise. Once potential fees reached $500, the majority or respondants would discourage participation
Should Schools support the cost of athletics?
Parents say yes.
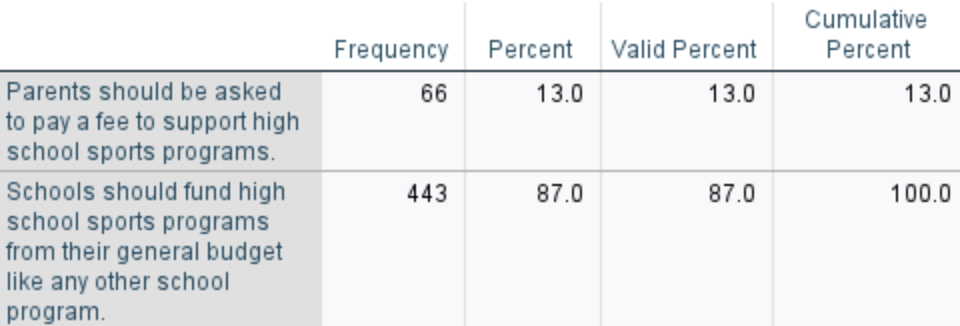
87% of responding parents selected that schools should fund school sports from their general budget, compared to only 13% saying parents should be asked to pay a fee to support athletic programs.
Parent opinions of sports--aside from costs
Parents belive that sports are beneficial to an aspect of academic success
respondents were asked if they saw sports as beneficial to attendance, grades, and likelyhood of graduating highschool
84% of parents said sports were benefical to at least one of the factors listed
61% of the parents surveyed participated in high school sports themselves.
Parents were asked to respond on a scale from strong disagreement to strong agreement about the following statements.
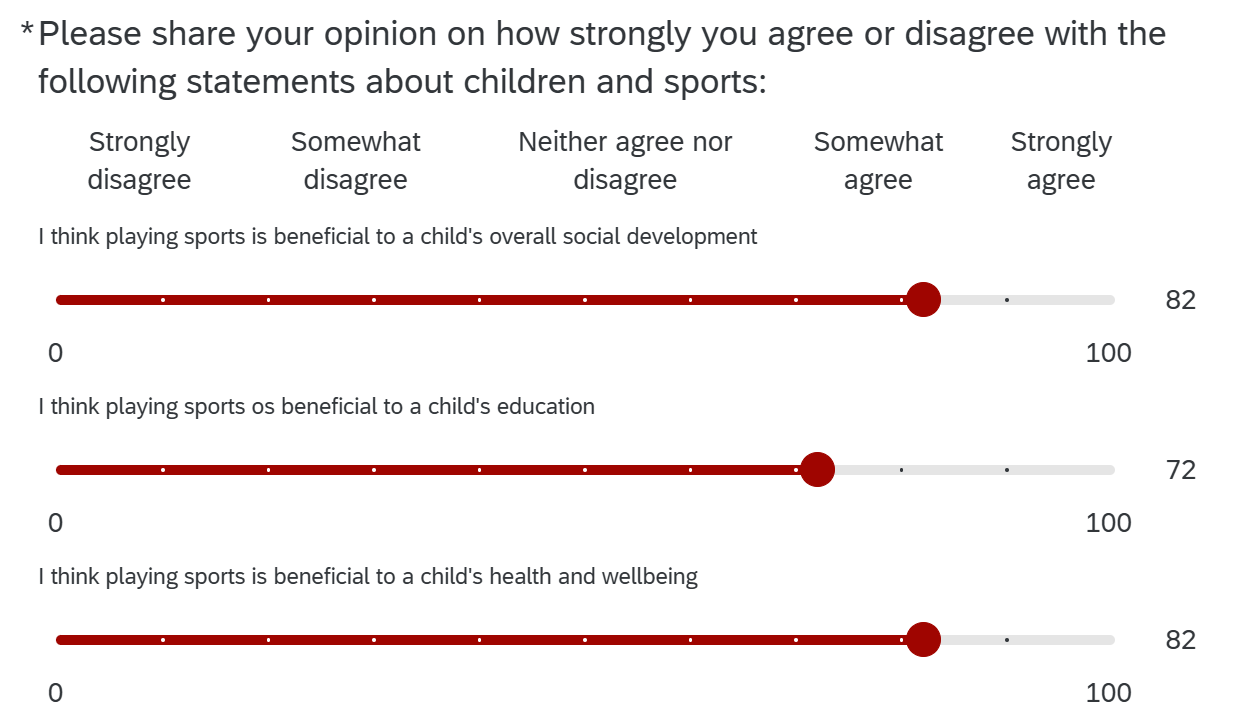
Demonstrates an overall belief that sports are beneficial to students lives. This chart represents the average responses across all survey participants.
Survey Respondents- Demographic Information
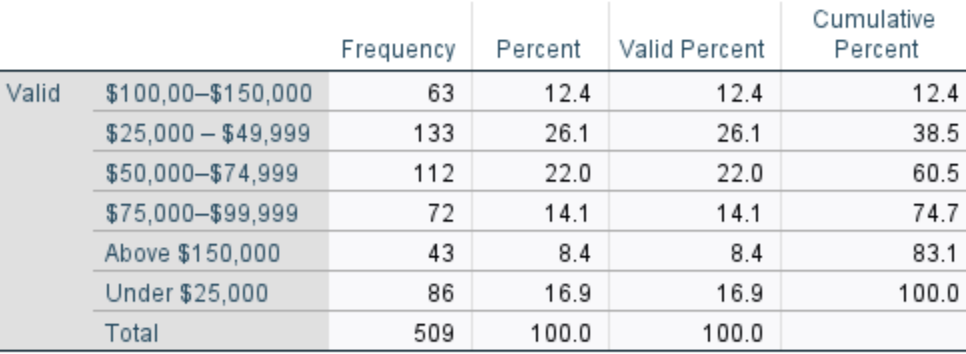
Annual household income of respondents
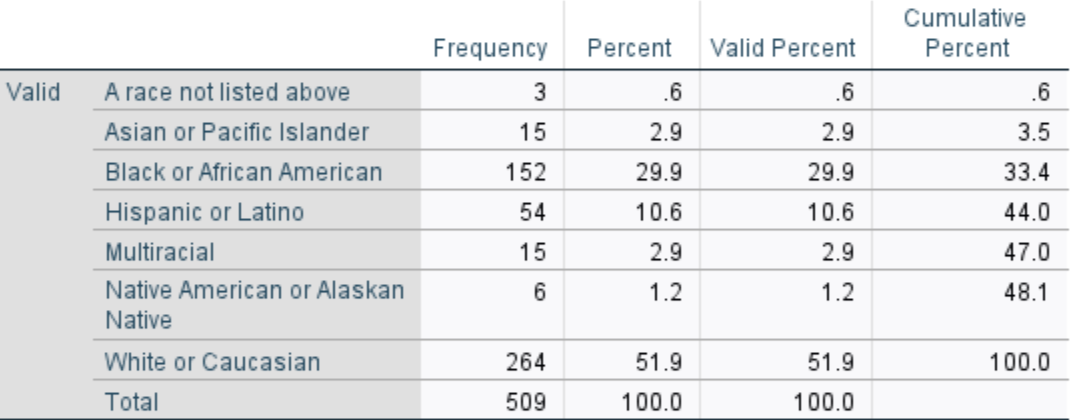
Self Described Race